
At its core, data analysis is the art and science of transforming raw data into actionable insights. It’s the process of turning vast streams of information into a meaningful narrative that businesses leverage to make smarter choices.
Now, more than ever, businesses are realizing that the difference between success and uncertainty lies in their ability to make informed decisions. Just look at the statistics. The global big data analytics market is valued at a staggering $307.52 billion, with projections pointing toward $745.15 billion by 2030. 91.9% of organizations have already reaped measurable value from their investments in data and analytics in 2023.
As businesses venture into this data-driven frontier, they’re investing in a paradigm shift. This shift empowers them to innovate, adapt, and thrive in an era where data is the cornerstone of strategic decision-making.
Let’s embark on a journey to unravel the world of data analysis, and lit the way to success in your businesses.
Types of Data Analysis in Research
There are two major classifications of data analysis: Quantitative data analysis and Qualitative data analysis. There are several types of data analytics process under each class.
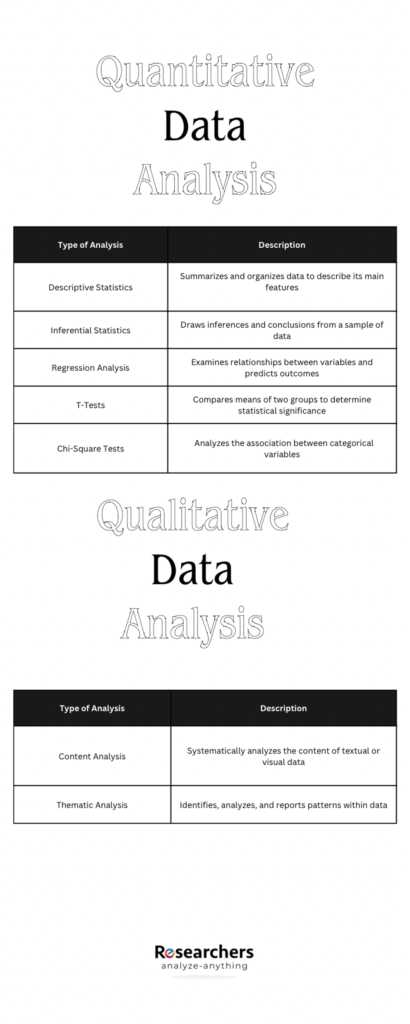
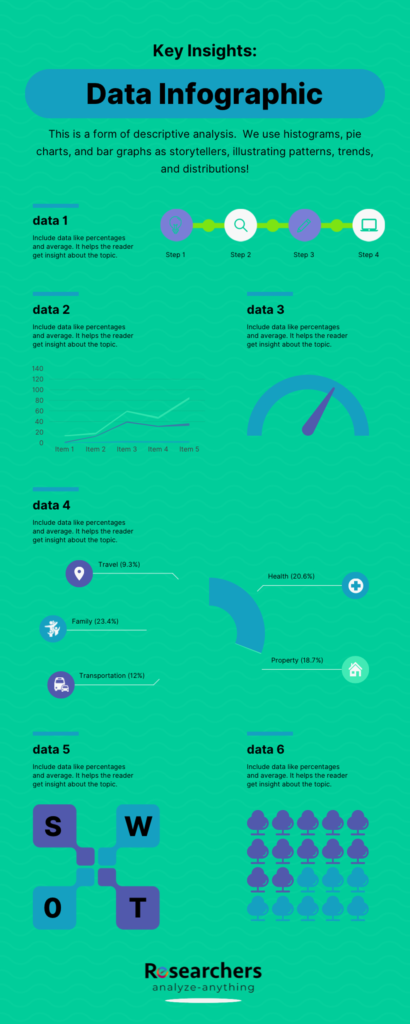
A. Descriptive Analysis
Descriptive analysis is the starting point of your data journey. It involves summarizing and presenting data in a meaningful way. This process includes measures of central tendency, such as mean, median, and mode. We use histograms, pie charts, and bar graphs as storytellers, illustrating patterns, trends, and distributions.
You can leverage descriptive analysis to understand your consumer demographics, preferences, and purchasing behavior. A retail giant would use this approach to create customer profiles based on buying patterns, which helps tailor their marketing strategies.
B. Inferential Analysis
Inferential analysis takes the insights gained from descriptive analysis and extends them into the future. It allows us to make predictions, draw conclusions, and unravel the mysteries hidden within the data.
Inferential analysis helps you make predictions and decisions beyond the observed data. An example is when you have survey results from a thousand customers (your sample), and you want to infer whether these findings hold true for your entire customer base (the population).
Statistical techniques used for inferential analysis include:
- Hypothesis testing,
- Regression analysis, and
- Confidence intervals.
C. Exploratory Data Analysis (EDA)
Imagine you’re handed a treasure map without any clues about where to dig. That’s where Exploratory Data Analysis (EDA) comes in—a compass, a magnifying glass, and a flashlight all rolled into one. Its primary role? To unearth hidden patterns, relationships, and potential treasures within your dataset.
Techniques and Tools Used for EDA
- Descriptive Statistics: the initial encounter with the data involves summarizing its main characteristics—mean, median, mode, standard deviation, and more.
- Data Visualization: Charts, graphs, and plots turn raw numbers into visual stories. Think histograms, scatter plots, and box plots.
- Correlation Analysis: Is there a connection between increased marketing spend and higher sales? Correlation analysis holds the answer.
- Clustering: EDA reveals groups or clusters within the data, grouping similar observations together. This can lead to the discovery of distinct customer segments, for instance.
- Outlier Detection: Unusual data points that don’t conform to the expected pattern may hide crucial insights or indicate errors. EDA spots these outliers.
D. Predictive Analysis
This sophisticated technique ventures into the future, and allows your business to forecast trends and outcomes. In healthcare, predictive analysis foresees disease outbreaks and patient trends, optimizing resource allocation. In finance, it aids in risk assessment and fraud detection, providing a shield against financial uncertainties.
Retailers utilize predictive modeling to forecast consumer preferences, ensuring your shelves are stocked with what customers desire.
Qualitative Data Analysis
Qualitative data plays a vital yet, often underestimated role. Qualitative data adds the human touch to analysis, providing depth and context to numerical findings. It encompasses non-numeric information like text, audio, images, or video. These reflect the intricacies of human experiences, attitudes, and behaviors.
The characteristics of qualitative data lie in its subjective nature. It thrives on the richness of details, allowing researchers to explore the why and how behind data points.
Methods in Qualitative Data Analysis
Content Analysis
Content analysis scrutinizes textual or visual data to identify patterns, themes, and meanings. By systematically coding and categorizing content, researchers unveil latent insights. This method proves invaluable in examining large volumes of data, making sense of diverse narratives.
Thematic Analysis
Thematic analysis involves identifying, analyzing, and reporting patterns within qualitative data. Datasets are distilled into “themes”. This method provides a structured approach to uncovering recurrent ideas or concepts. Thematic analysis lends itself well to a variety of research questions, making it a versatile tool to have in your toolkit.
Tools and Software for Data Analytics Process
Data Analysis is carried out by an array of specialized tools. We only mentioned the three most used softwares.
Excel
Microsoft Excel stands as a stalwart, wielding its spreadsheet prowess. Excel is the starting point for many analysts. It offers features for data entry, manipulation, and basic analysis. From pivot tables to formulas, Excel is a foundational toolkit for almost every data analyst.
Python and R
As the demand for more sophisticated analyses grows, programming languages like Python and R have emerged as powerful tools. Python is versatile and extends beyond general-purpose programming to data manipulation. They also perform analysis through libraries like Pandas and NumPy.
R, on the other hand, caters specifically to statisticians and data scientists. It is the ideal tool used by experts for statistical modeling and visualization.
Data Visualization Tools
Tableau, Power BI, and Google Data Studio offer intuitive interfaces for creating interactive dashboards and reports. These tools empower analysts to communicate findings effectively, turning complex datasets into stories that resonate.
Challenges and Considerations in Data Analysis
As data analysis becomes integral to decision-making, confronting bias is paramount. Biases, whether implicit or systemic, skew results. Analysts must be vigilant in recognizing and rectifying biases in datasets, ensuring that insights derived are fair and representative. Employing diverse perspectives contributes to a more comprehensive understanding and mitigates bias.
Another bone of contention is our data security. Amid the data deluge, safeguarding privacy and maintaining security are necessary. With regulations like GDPR and increasing awareness around data breaches, organizations must prioritize protecting sensitive information. Encrypt your data and employ stringent access controls to handle your data. Balancing the quest for insights with a commitment to privacy builds trust and resilience in the analytical journey.
Conclusion
Data analysis is the future. Your business needs a glimpse into this future. Take the next step in your data analysis journey by joining Researchers.me.
Connect with like-minded professionals, explore cutting-edge insights, and stay ahead in the dynamic landscape of data analysis.
Don’t just analyze data; be part of a community that shapes the future of analytics. Join Researchers.me today and unlock a world of opportunities!