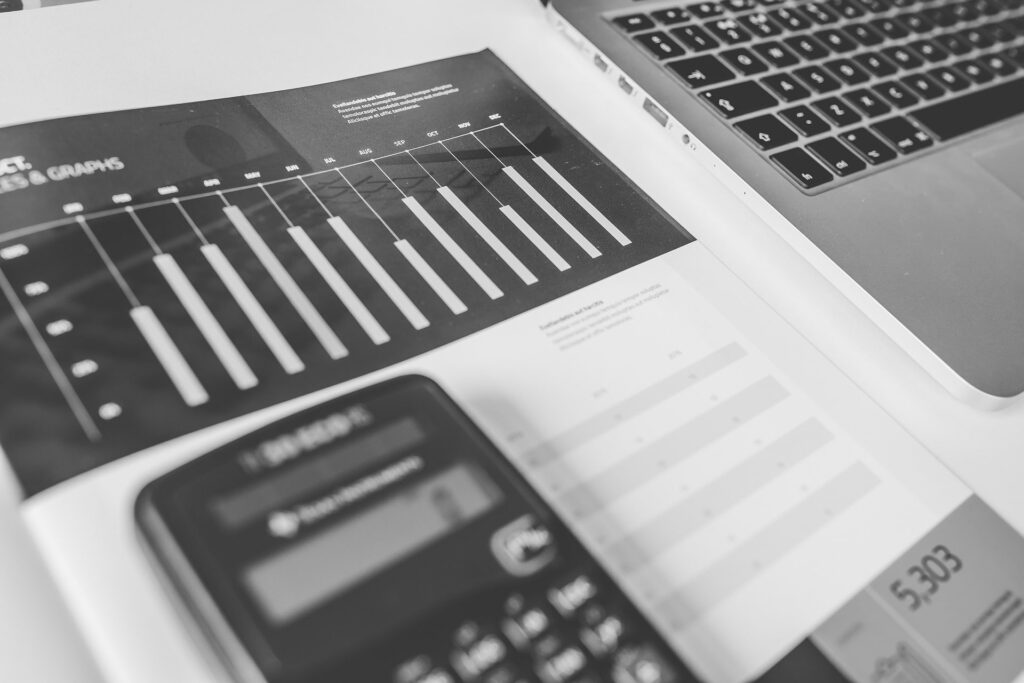
The key performance indicators (KPIs) of a business are shown graphically in dashboard reporting. It describes the practice of using data visualizations to track and report on business performance.
It helps businesses make more informed decisions by
KPIs visualization,
Performance monitoring
And additionally, the ability to interact with data within the dashboard to evaluate patterns and obtain insights, giving you the chance to act right away and make changes.
It enables everyone in a company, regardless of technology skill level, to analyze data in real time through an intuitive dashboard.
Different types of charts, tables, graphs, and maps form dashboard reporting.
Types of dashboard reporting
Dashboard reporting is classified into the following categories based on the needs of an organization: