
Market trends analysis serves as a compass for your brand. It ensures you stay relevant and competitive.
Market analysis in the UAE enables you to predict changes in consumer preferences, upcoming technology, and economic circumstances. It is the secret of growth and adaptation.
Data analytics of market trends reveal hidden patterns, anomalies, and insights for your consumption. The basis for analysis is provided by data and statistics. These numbers are translated into a language that everyone can comprehend by the use of visual aids. They give trends a lively, perceptive quality. They enable organizations to make data-driven decisions and effectively share insights.
We’ll explore the practice of market trend analysis in this guide. We expose the techniques, resources, and plans that modern firms need to succeed.
Why You Need to Understand Market Trends?
Market trends are enduring patterns that capture shifts in consumer wants and preferences within a particular industry. Knowing market trends aids in:
- Identifying and forecasting market trends. This enables you to modify your offers and tactics to meet changing client needs.
- Keeping you updated abreast with market developments. Businesses that adopt trends quicker are always at a competitive advantage.
- Making informed choices at every point. Whether it’s new market penetration, marketing plans, or product development.
- Early detection of possible problems . This enables businesses to create risk-reduction plans.
- Boosting income, sales, and long-term profitability.
Difference Between Short-Term and Long-Term Trends

How to Gather Data for Analysis?
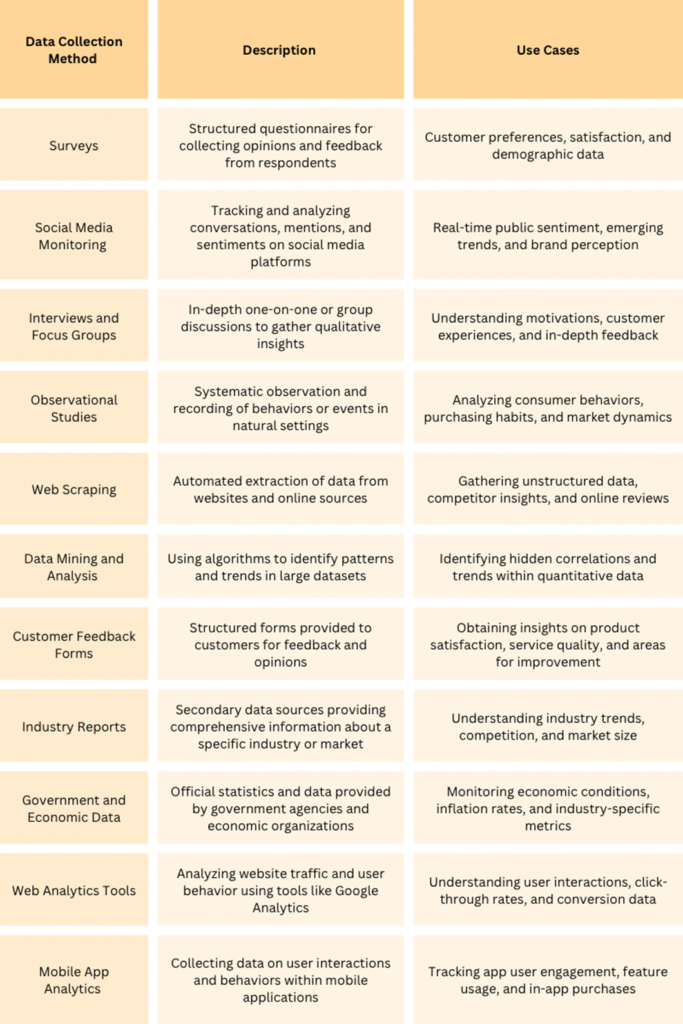
Market trend research uses a wide range of data sources to accurately depict the state of the industry. There are many different kinds of data in these sources. Different perspectives are provided by each category to help comprehend market developments.
Data Types for Market Analysis
Surveys
Surveys are a useful tool for getting direct input from stakeholders, customers, and business leaders. They offer perceptions into the tastes, contentment, and new trends of the consumer. Surveys can be carried out in-person, over the phone, or online. They focus on particular areas of market analysis.
Social Media
Keeping an eye on social media sites like Instagram, Twitter, and Facebook gives you instant access to popular opinion. Understanding what people are talking about, appreciating, and criticizing is possible through the analysis of user-generated material. It’s a useful resource for learning about Market Trend Analysis Today.
Industry Reports
Trade periodicals and market research papers are good sources for industry reports. Research companies frequently provide these in-depth reports, which include a plethora of market data. These consist of past patterns, present circumstances, and anticipated future developments. They offer a thorough comprehension of consumer behavior, market segments, and competition.
Government and Economic Data
Government agencies and economic organizations provide official statistics on economic indicators, employment, inflation, and other relevant data. This data helps in understanding the broader economic context within which market trends evolve.
Internal Data
Businesses make use of their website statistics, customer databases, and sales information. Sales trends, product performance, and client purchasing habits are all sources for analysing internal data.
Other sources of data for analysis include:
- Competitor data
- Academic research
- Focus groups
- Web scrapings
Why You Need to Collect Both Qualitative and Quantitative Data?
Collection of both qualitative and quantitative data in market trend analysis is paramount for a comprehensive understanding. Qualitative data lends depth and context. It answers the “why” behind trends. Quantitative data quantifies the “what” and “how much,” measuring the magnitude and patterns.
The dynamic interplay between the two not only validates trends but also fosters predictive accuracy. Qualitative data explores the nuances of customer experiences, unearths emerging trends, and provides human-centered insights. Quantitative data establishes a robust foundation for forecasting and making well-informed decisions. Together, they empower holistic decision-making, ensuring that businesses navigate market trends with clarity and agility.
How to Carry out Data Analysis?
Cleaning and preprocessing data is the first step in market trend analysis. Raw data often contains errors, inconsistencies, and irrelevant information. It is essential to prepare the data for accurate analysis. Here’s a step-by-step guide on how to clean and preprocess data:
Step 1: Begin with the collection of data from various sources, such as surveys, social media, or industry reports.
Step 2: Thoroughly inspect the data to identify any missing values, duplicate entries, or outliers.
Step 3: If there is missing data, decide how to handle it. You can:
- Impute it,
- Remove rows, or
- Use placeholder values.
Step 4: Search for and remove duplicate entries that skew analysis. Decide which columns or attributes should be used as unique identifiers when checking for duplicates.
Step 5: Convert data into a consistent format and structure. Standardize data units (e.g., currency, date formats) for consistency. Convert categorical data into numerical values if needed (e.g., one-hot encoding).
Step 6: Identify and assess outliers that distort analysis. Decide whether to remove outliers or transform them to minimize their impact.
Step 7: Normalize or scale numerical data to ensure all attributes have the same weight in analysis. Common techniques include min-max scaling and z-score normalization.
Step 8: Choose the relevant features (columns) for analysis. Eliminate irrelevant or redundant attributes to simplify the dataset.
Step 9: Split the data into training and test sets for model development and evaluation. Typically, you allocate around 70-80% for training and the rest for testing.
Step 10: Verify the cleaned and preprocessed data for accuracy and consistency. Confirm that it is now ready for analysis and model development.
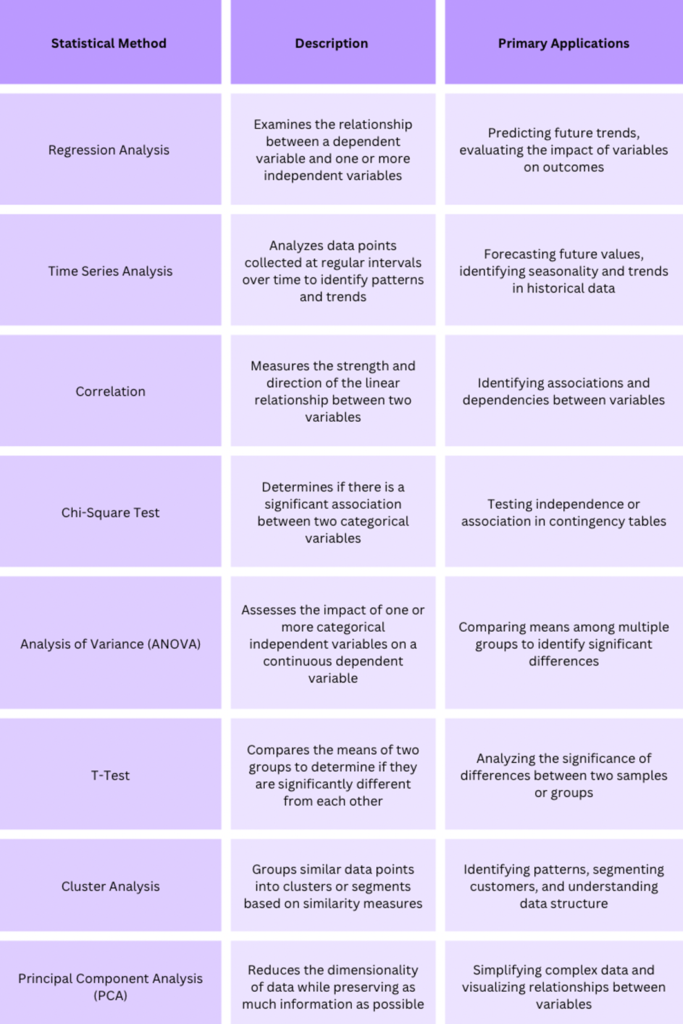
Statistical Methods and Tools for Analyzing Data
Role of Visual Aids in Data Analysis
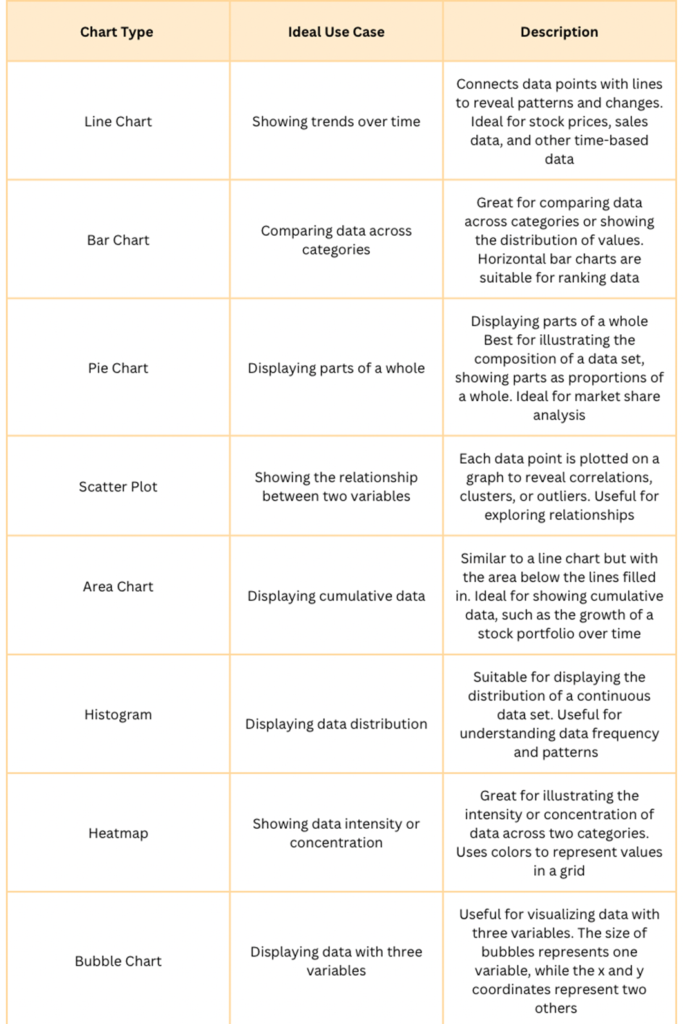
Charts and tables are indispensable tools in representing market trend analysis reports. They serve as visual aids that transform raw data into clear, concise, and easily understandable representations. They simplify complex data allowing analysts to grasp trends and insights at a glance.
Visual representations make it easier to spot patterns, anomalies, and correlations in the data. They facilitate the comparison of data across different categories or time periods.
Choosing the Right Type of Chart for Specific Data
Selecting the appropriate chart type is crucial for effective visualization. Here’s a guide to choosing the right chart for specific data:
Using Tools like Canva to Create and Customize Charts and Tables
Tools like Canva offer a user-friendly platform for creating and customizing charts and tables. Here’s how to use Canva for this purpose:
Step 1: Sign in to Canva or create an account if you don’t have one.
Step 2: Canva offers a variety of chart and table templates. Choose the one that best suits your data visualization needs.
Step 3: Enter your data into the template. Canva often provides user-friendly data input options.
Step 4: Customize the appearance of your chart or table. Change colors, fonts, and add labels and titles.
Step 5: Once you’re satisfied with the design, export it in various formats (e.g., PNG, PDF) for use in reports, presentations, or websites.
How to Interpret Trends in Data and Visual Aids?
Below are the key points you need to take while examining data and visual aids for market trends:
- Begin by observing patterns in the data. Look for consistent increases or decreases over time, clusters of data points, or recurring cycles.
- Examine points where there are abrupt changes or spikes in the data. These indicate significant events or shifts in the trend.
- Ensure you’re considering an appropriate data range. A short-term view might reveal short-lived trends, while a long-term view can show more enduring ones.
- Look for outliers in the data, points that deviate significantly from the trend. These signify anomalies or events impacting the trend.
- Use scatter plots to identify correlations between variables. If one variable’s changes consistently coincide with another’s, there may be a relationship.
- Consider the context. Factors like seasonality or holidays influence trends. Factor these into your interpretation.
- If possible, quantify the changes observed. This involves calculating growth rates, percentages, or other metrics.
- Rely on domain knowledge and expertise to explain trends. Sometimes, only an industry expert can fully grasp the implications.
Conclusion
Market trend analysis relies on diverse data sources and the effective use of data visualization. Carrying out these technical steps for your analysis sometimes requires the eye of an industry expert. A market analysis company like Researchers.me helps you carry out all the essential steps that yield the best marketing result for your firm with ease.
Make data-driven decisions and empower your businesses with the right knowledge of industry trends today!